Hi! I'm a designer. I create digital experiences and information graphics that feel simple, thoughtful, and human.
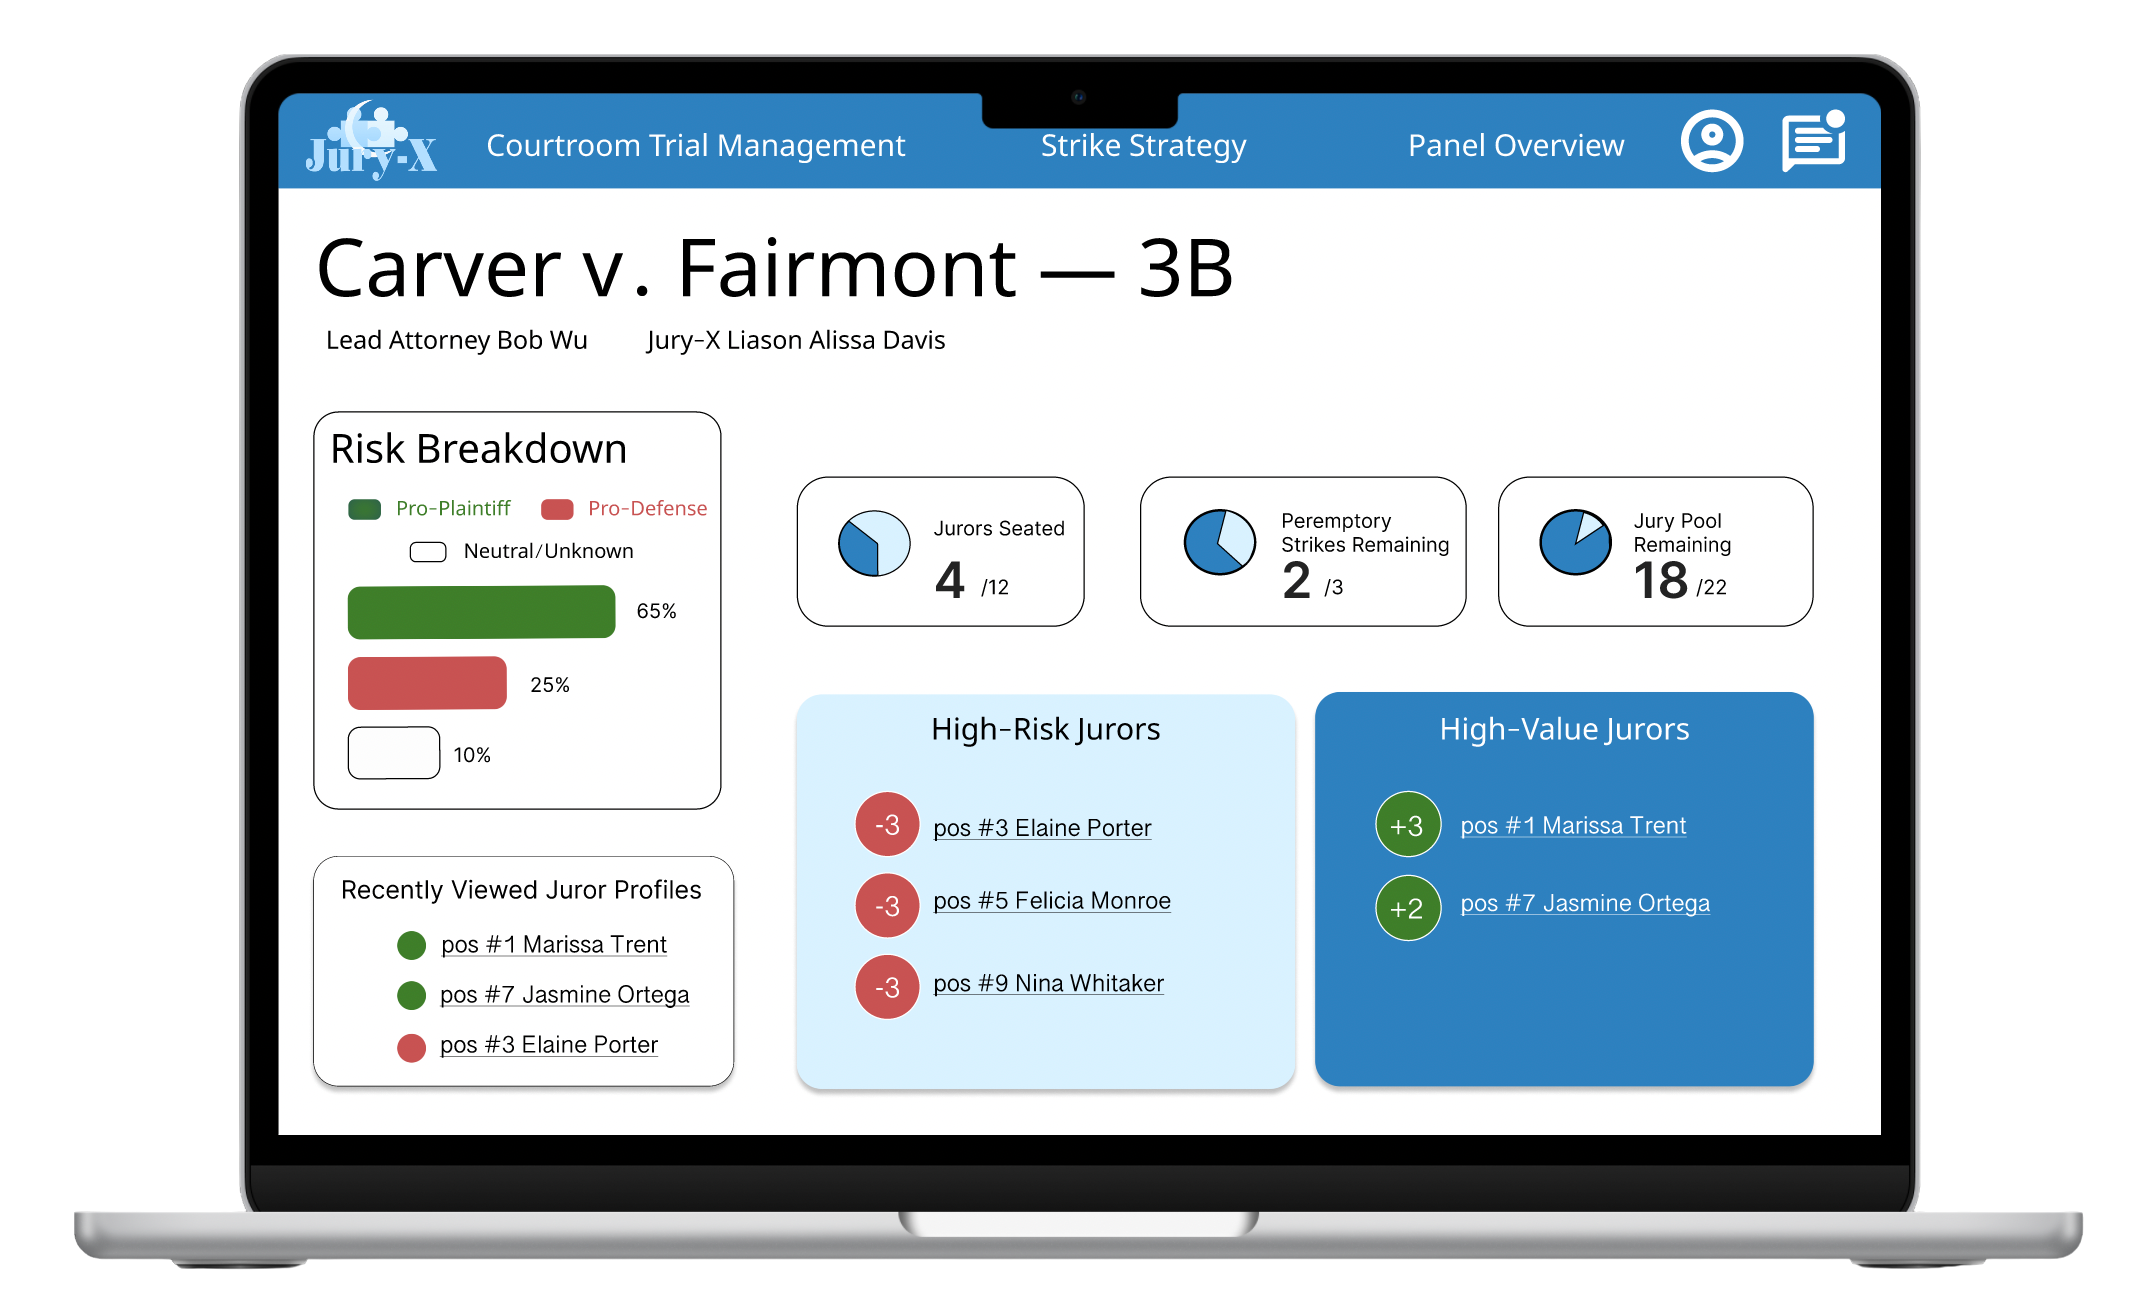
I ideated and designed this prototype using Figma for a class project, and in partnership with an external client, Jury-X Legal Services. This project lasted a full semester (~13 weeks) and included creating personas, conducting participant interviews, mapping user flows, as well as designing wireframes and the final prototype.
See my full process here.
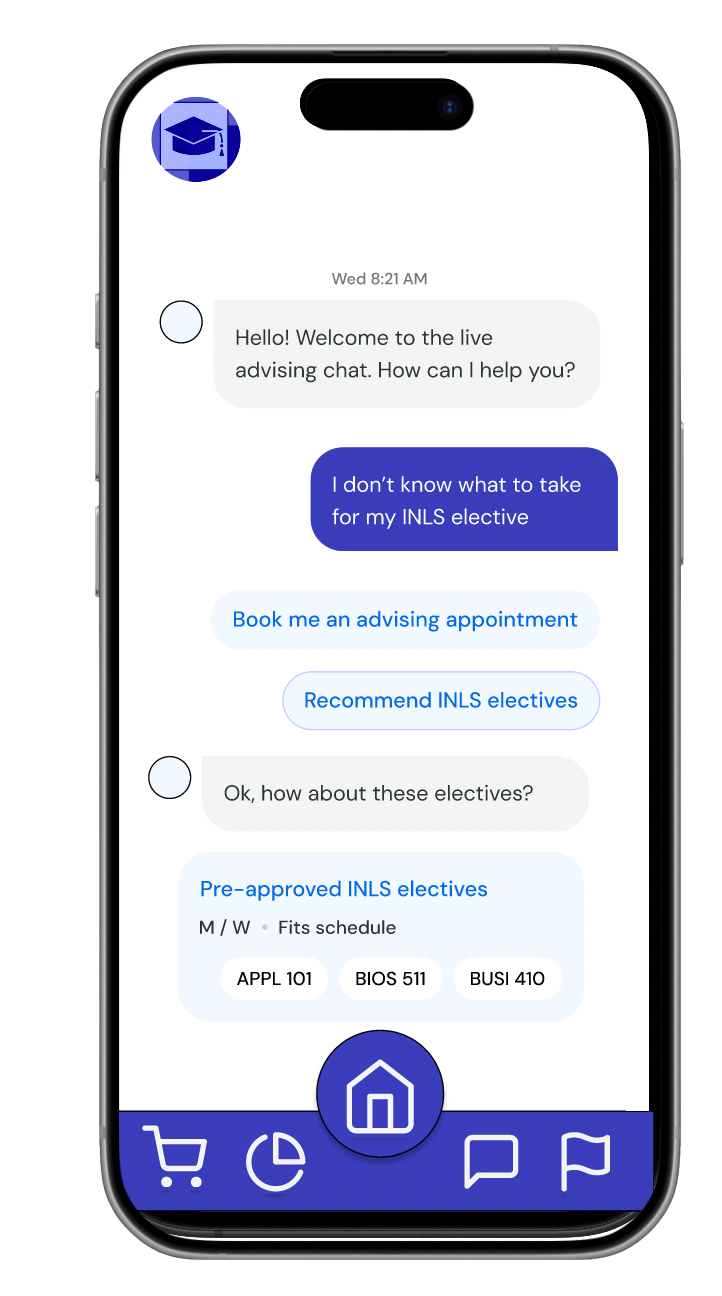
I ideated and designed this prototype using Figma for a class assignment. We were tasked to design an improved interface for our current university registration platform. We were assigned to complete this task over the course of ~1 week.
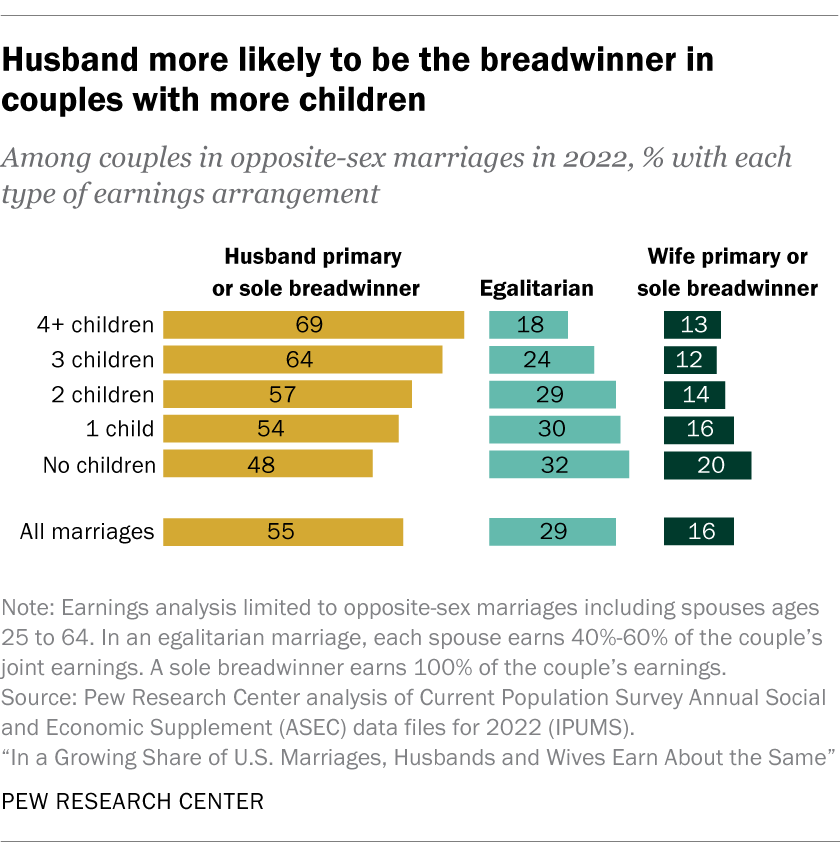
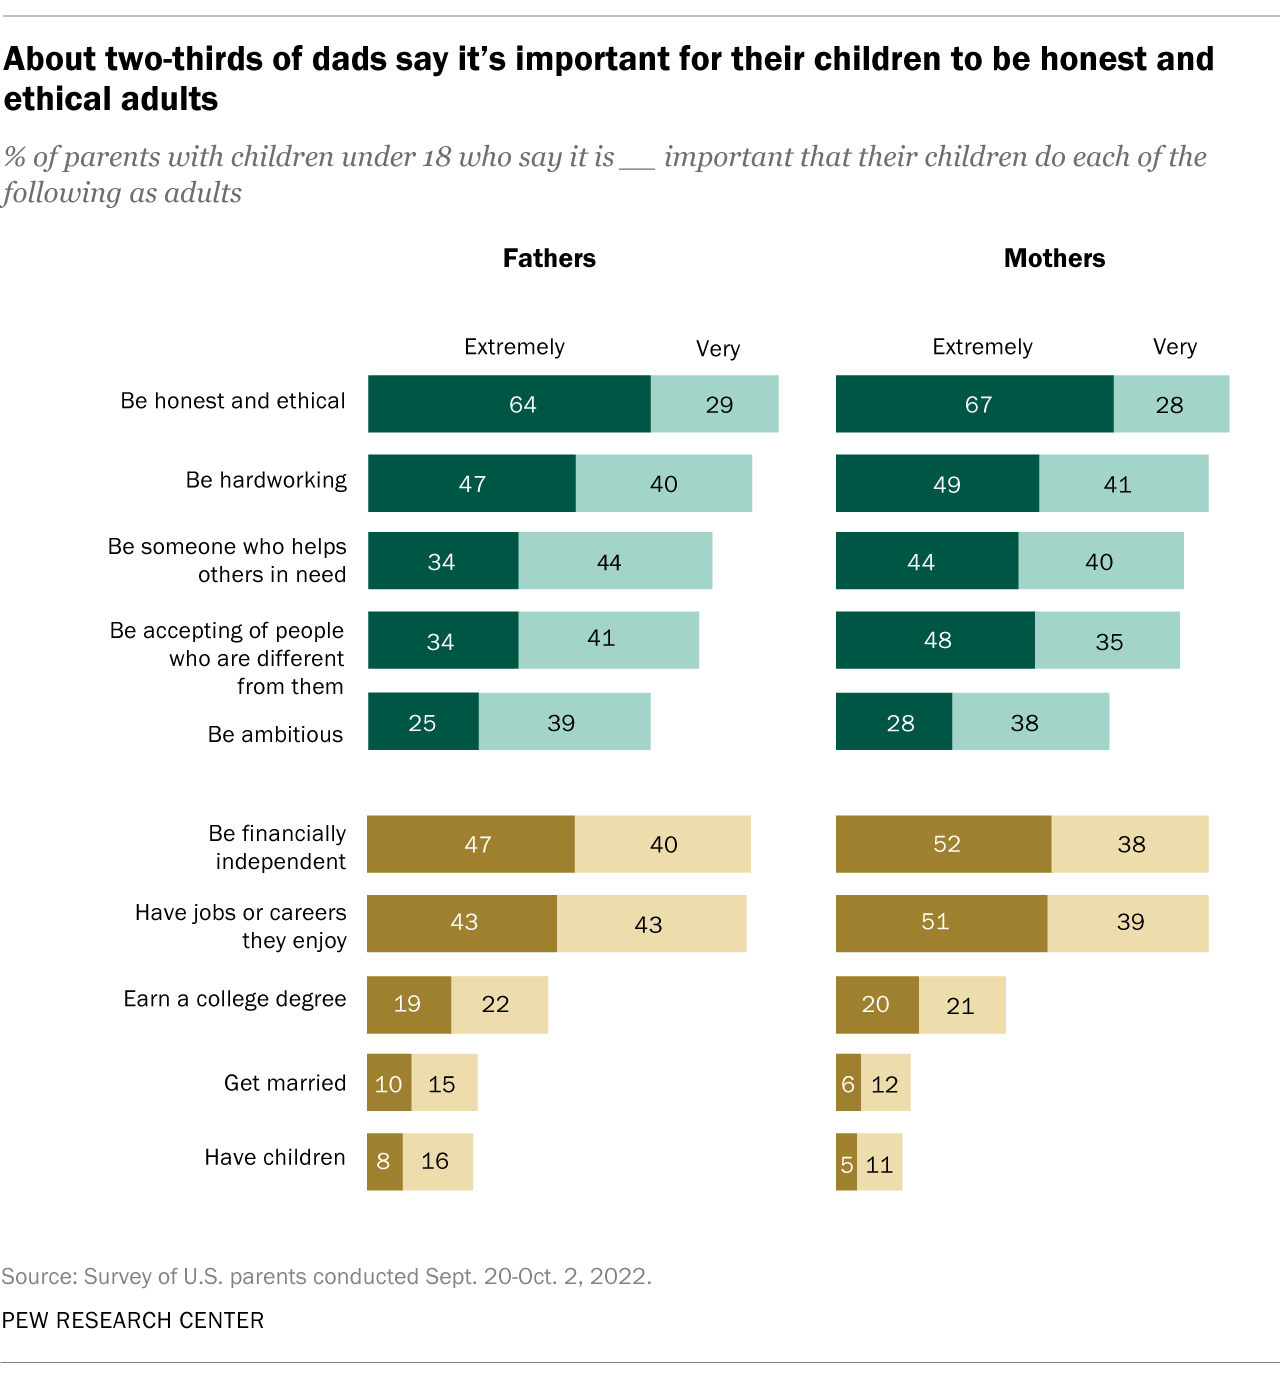
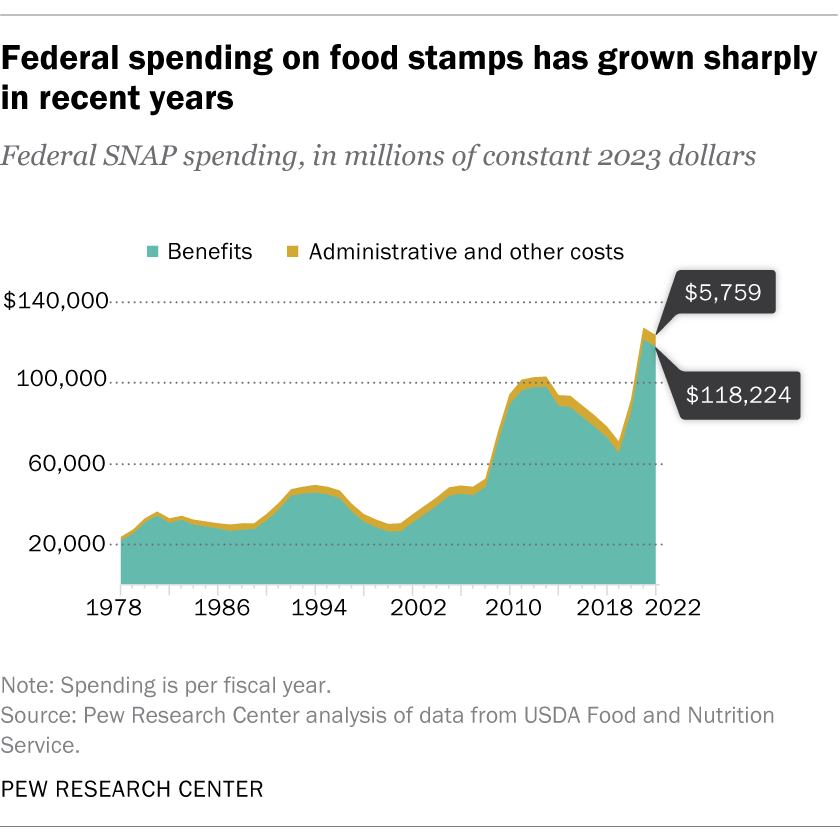
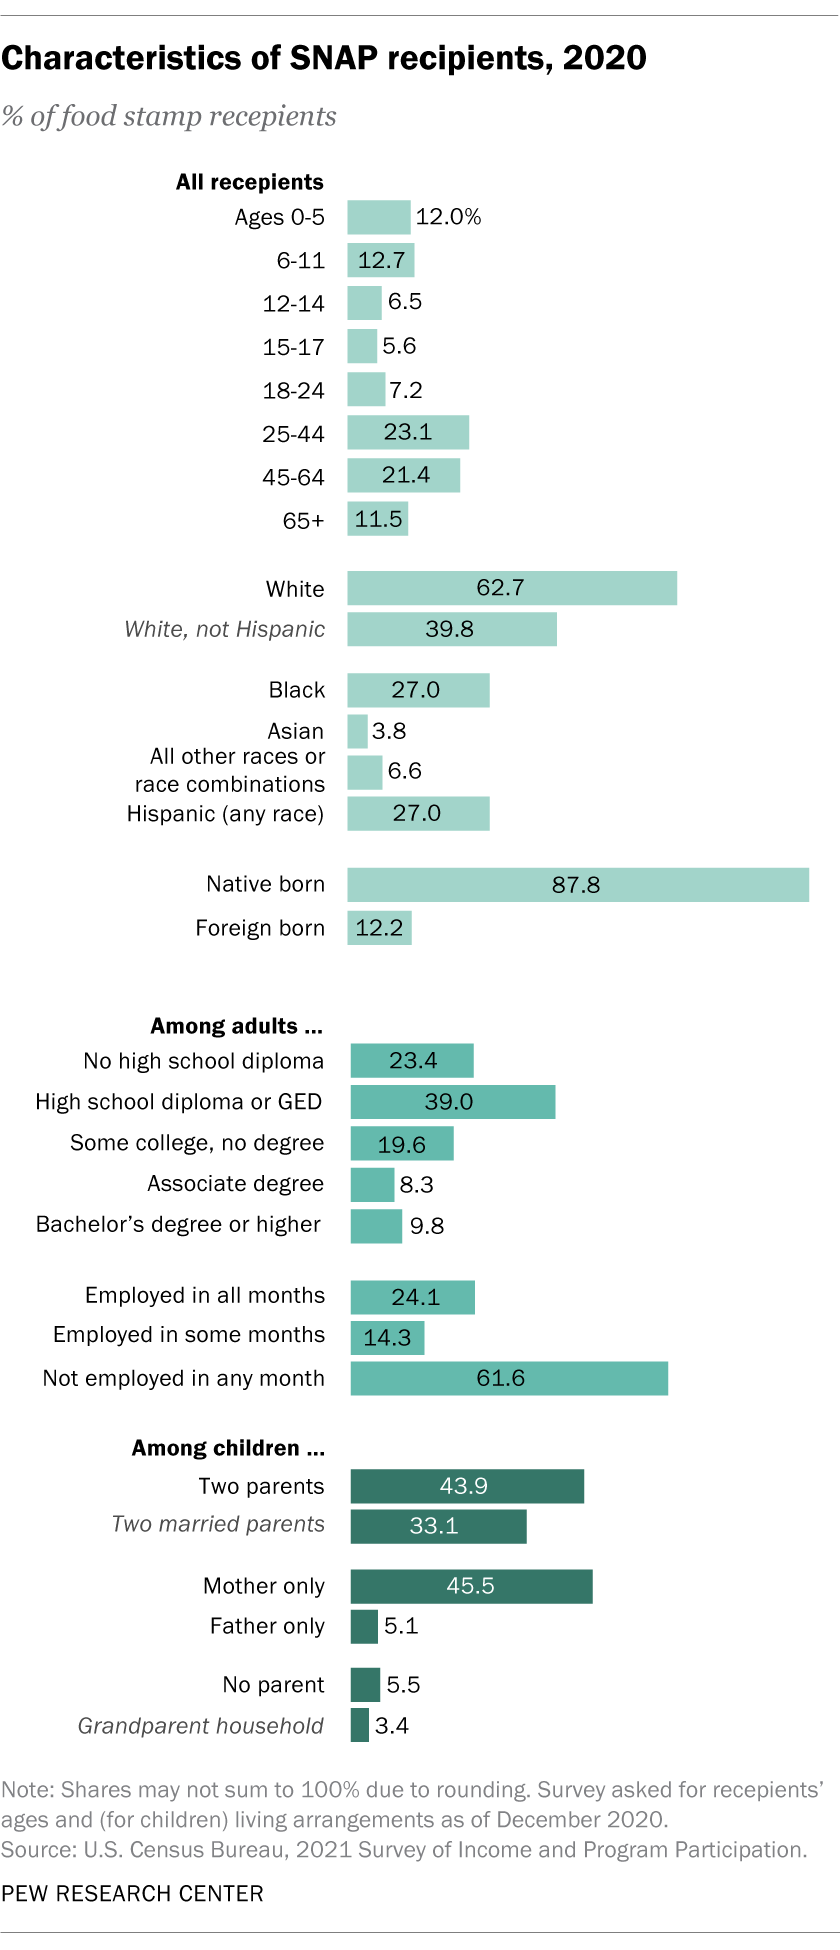
All data visualizations are my designs for publication at Pew Research Center. All Pew visualizations were made using data collected and cleaned by their research team. I recieved guidance from mentors on chart type suggestions, and I typically designed 1-3 iterations, each adjusted based on feedback before arriving at the final chart.
Note: the food stamp charts were published from 2023-2026, but were recently replaced to reflect new food stamp data. All other designs are still currently featured on their website.

Project:
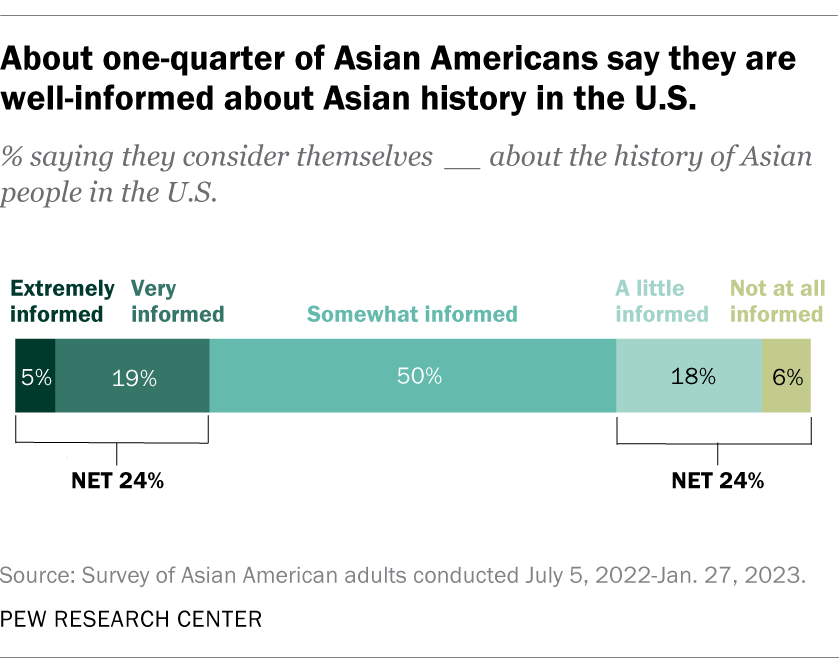
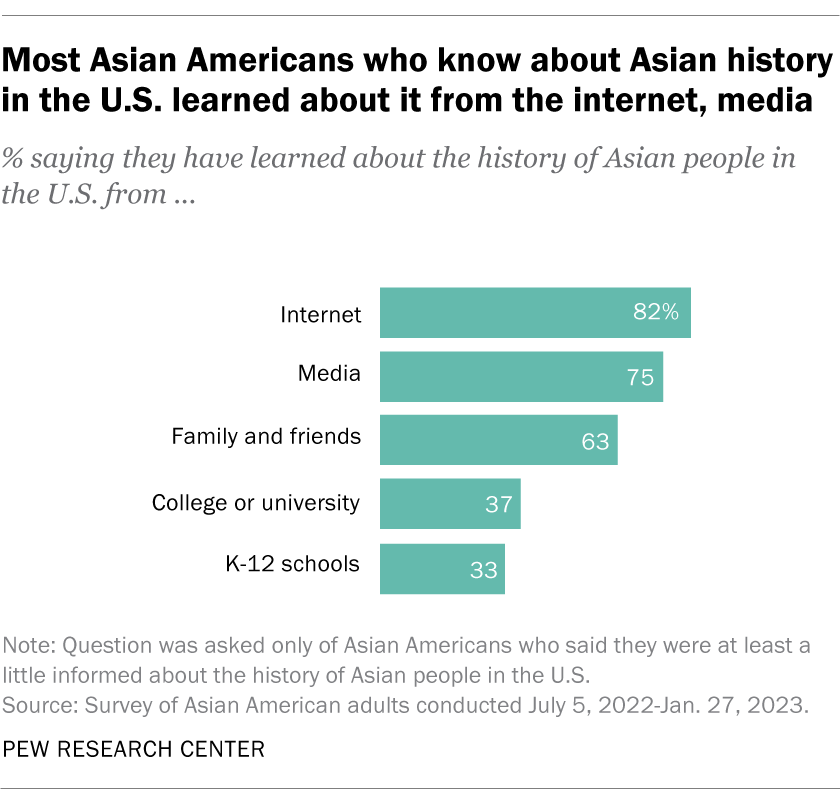
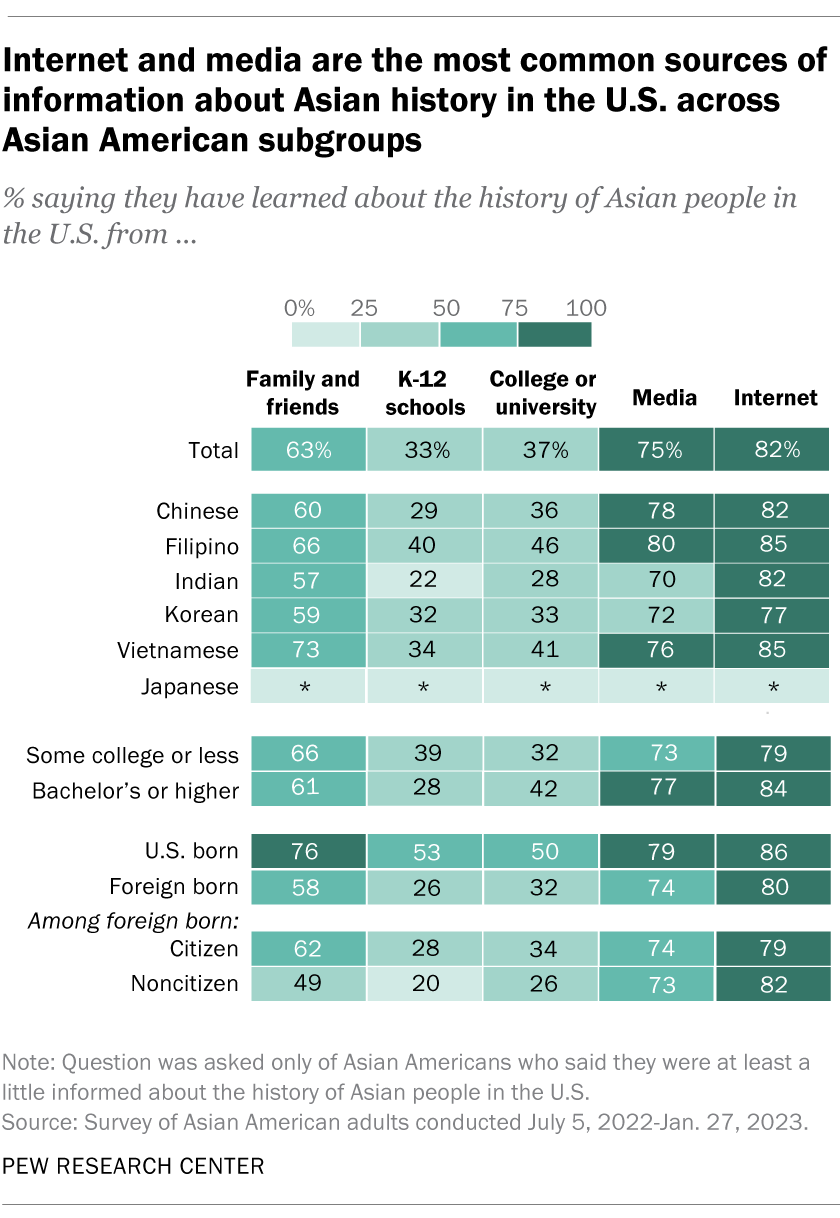
Pew Research Center Asian American History KnowledgeTools:
Excel, Adobe Illustrator Published here