Data Viz

All data visualizations are my designs for class or for publication at Pew Research Center. All Pew visualizations were made using data collected by their research team.

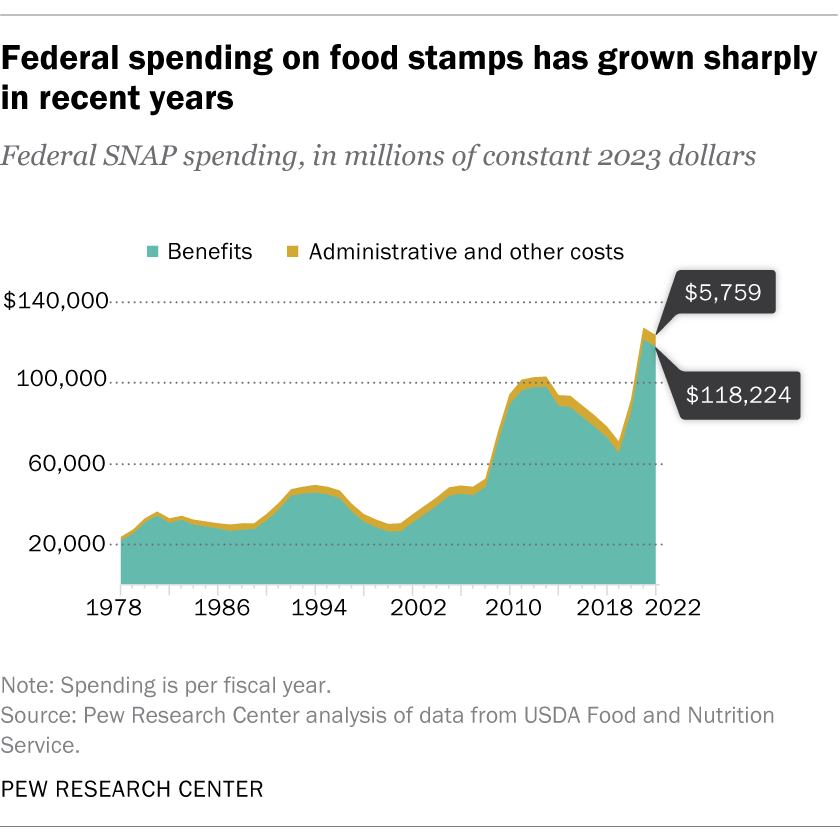
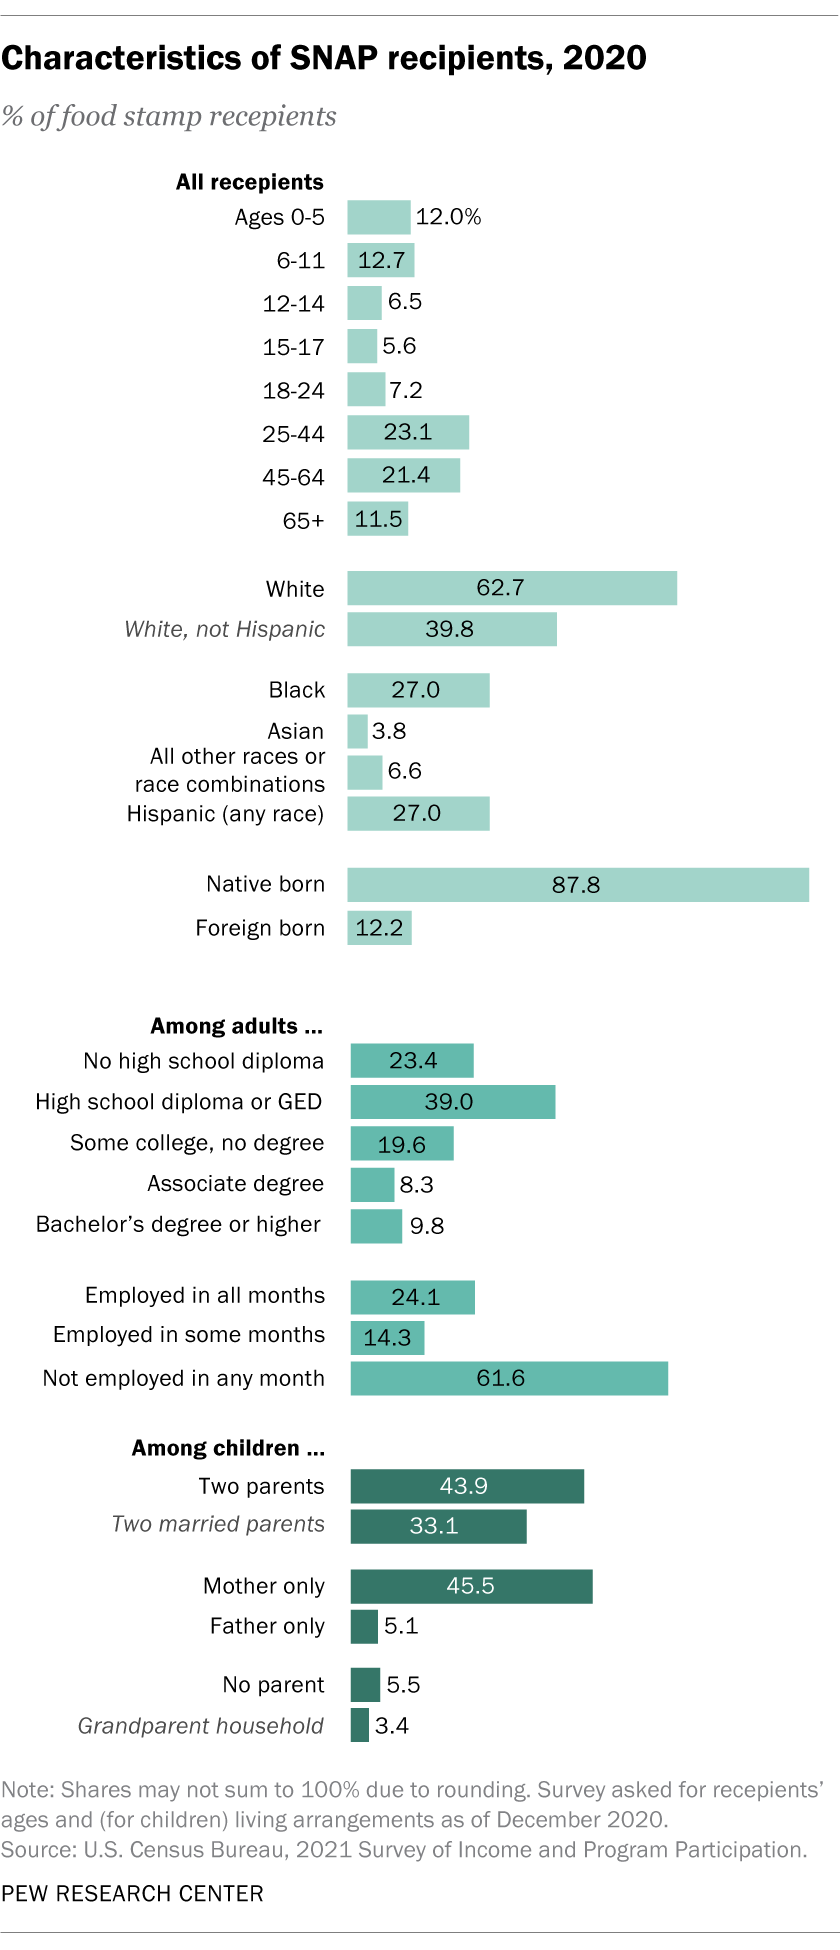
Project: Pew Research Center Food Stamp Usage

Tools: Excel, Adobe Illustrator

Published here
stacked line chart of federal spending on food stamps line chart showing people and household food stamp usage over time bar chart showing characteristics of SNAP recepients

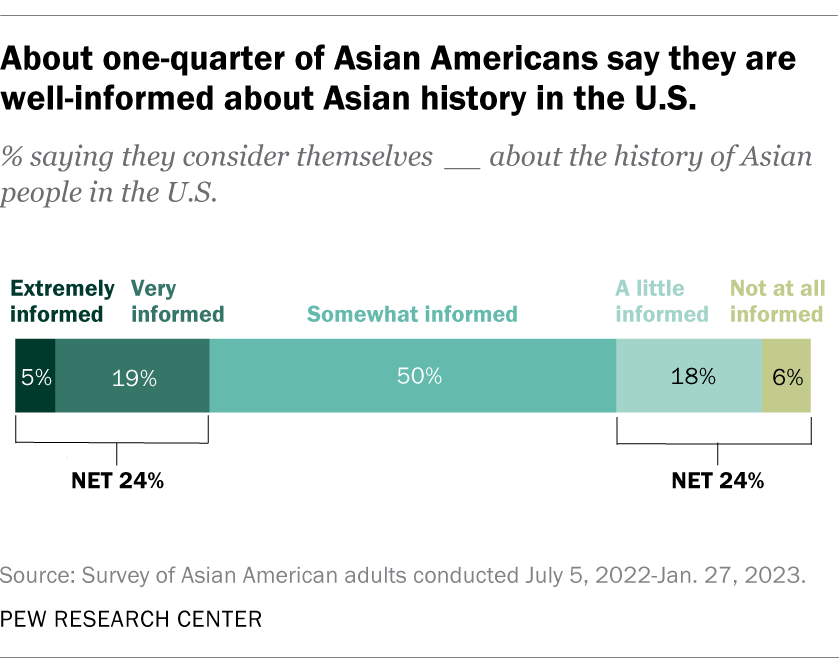
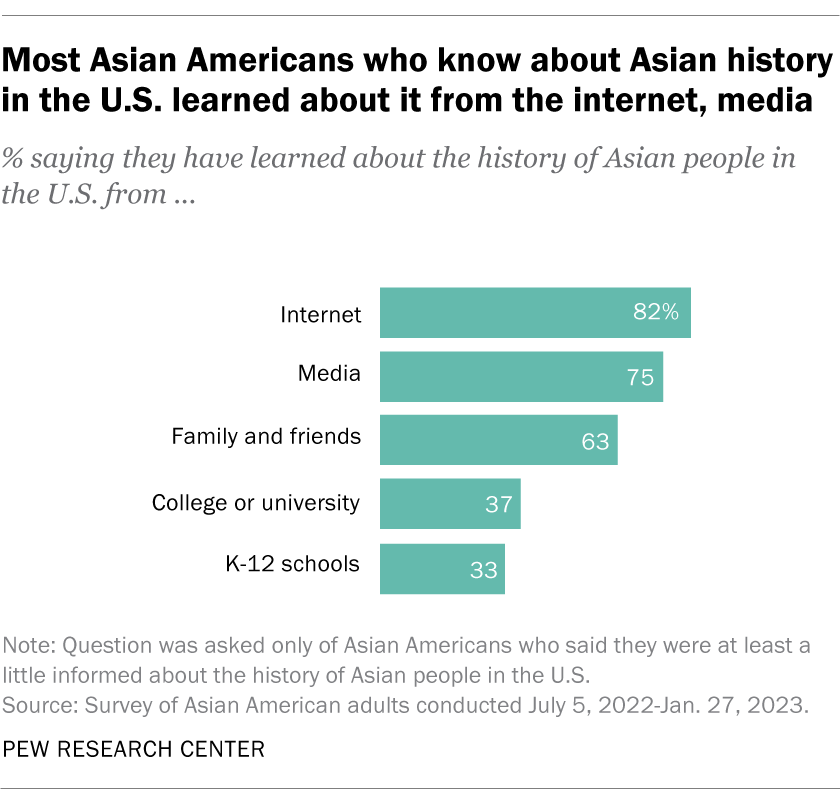
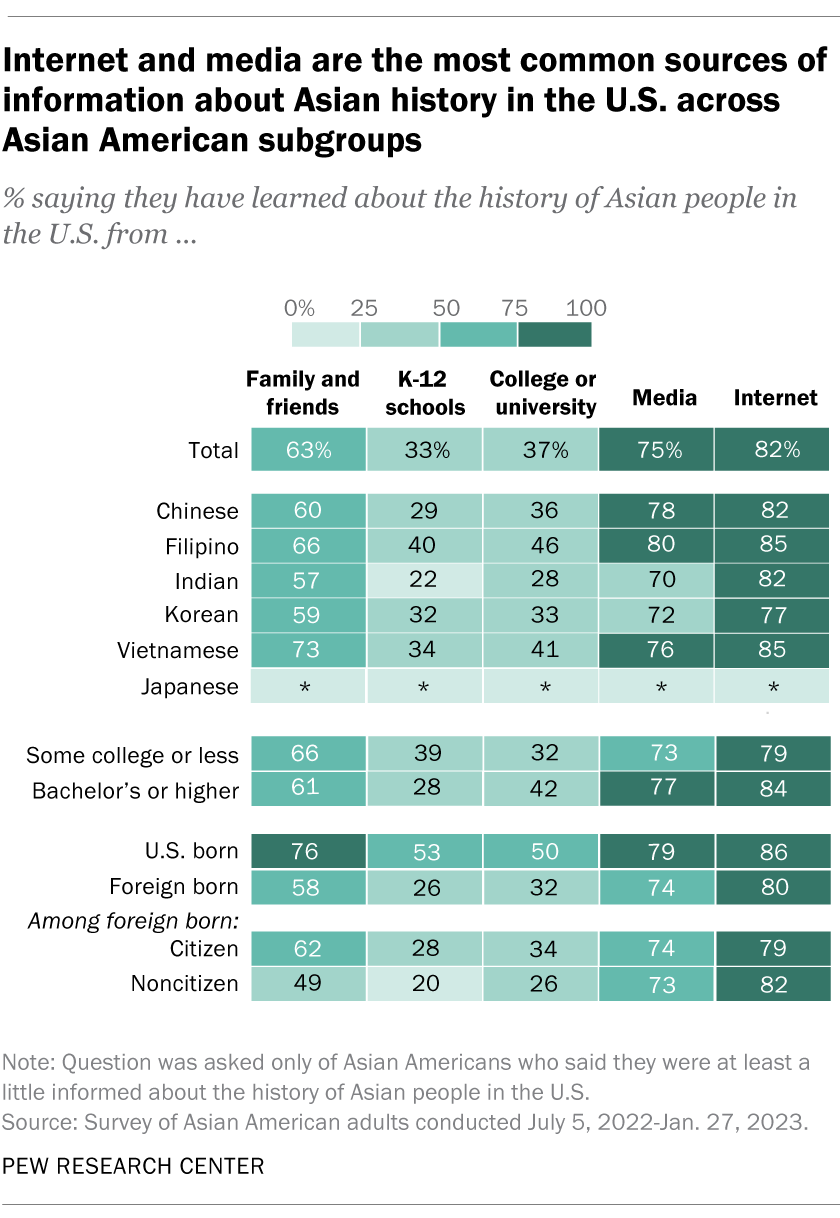
Project: Pew Research Center Asian American History Knowledge

Tools: Excel, Adobe Illustrator

Published here
stacked bar chart showing how Asian Americans rate their knowledge of Asian history in the U.S. bar chart showing sources where Asian Americans learned about Asian history in the U.S. table color coded as a heat map to break down where different Asian ethnicities and sub-groups learned about Asian history in the U.S.